The Captive Scorecard: One Honest Look at How Your Captive Is Doing

A captive is a real insurance company, and its health shows across several measures at once: is it making an underwriting profit, does it hold enough capital, and does it have the cash to pay claims as they fall due? Each of these has its own ratio and benchmark, and they usually sit in different places — a reserving report here, a capital calculation there, a cashflow view somewhere else. The Captive Scorecard brings them all into one place, available at any time.
Why does a joined-up view matter?
Seeing the numbers side by side is what lets you spot a trend early. A captive can trade profitably while its reserves climb against its surplus, or while its cash position quietly tightens — and looking at any one measure alone would miss it. Regulators look across the same spread of measures: in the EU, Solvency II links required capital to the risks a captive runs; in the US, risk-based capital highlights when a captive is running light on capital; and in the UK, the Bank of England's CP11/26 tailored captive regime, published in July 2026 with launch expected around mid-2027, takes a similar rounded view. A genuinely sound captive shows strength on several fronts at once, not just one.
What does the Captive Scorecard give you?
It gives you one simple grid covering underwriting profitability, leverage against capital and reserves, and liquidity — each marked year by year as on track, worth a look, or breached. It runs entirely on the captive's own figures inside the same governed platform as your reserving and capital data. A ratio heading the wrong way turns amber early, while there is still headroom to act. You set the levels yourself, and you can pitch them tighter than the regulator's thresholds to build in extra margin. The result is a one-page answer to the question a board actually asks: how is this captive actually doing?
Why can you stand behind every mark?
- Clear, standard calculations — each ratio uses a standard formula, so the same numbers in always give the same scorecard out.
- Every number shows where it came from — each result sits beside its explanation and its target, so you can see exactly how the mark was reached.
- You set the bar — every threshold is yours to set, and you can set it higher than the regulator's if you want more headroom.
- The whole picture, side by side — all the measures are shown together, year after year, so trends are visible rather than buried.
This is the same show-your-working approach we take to reserve adequacy monitoring, where the same principles apply to the reserves behind the leverage mark.
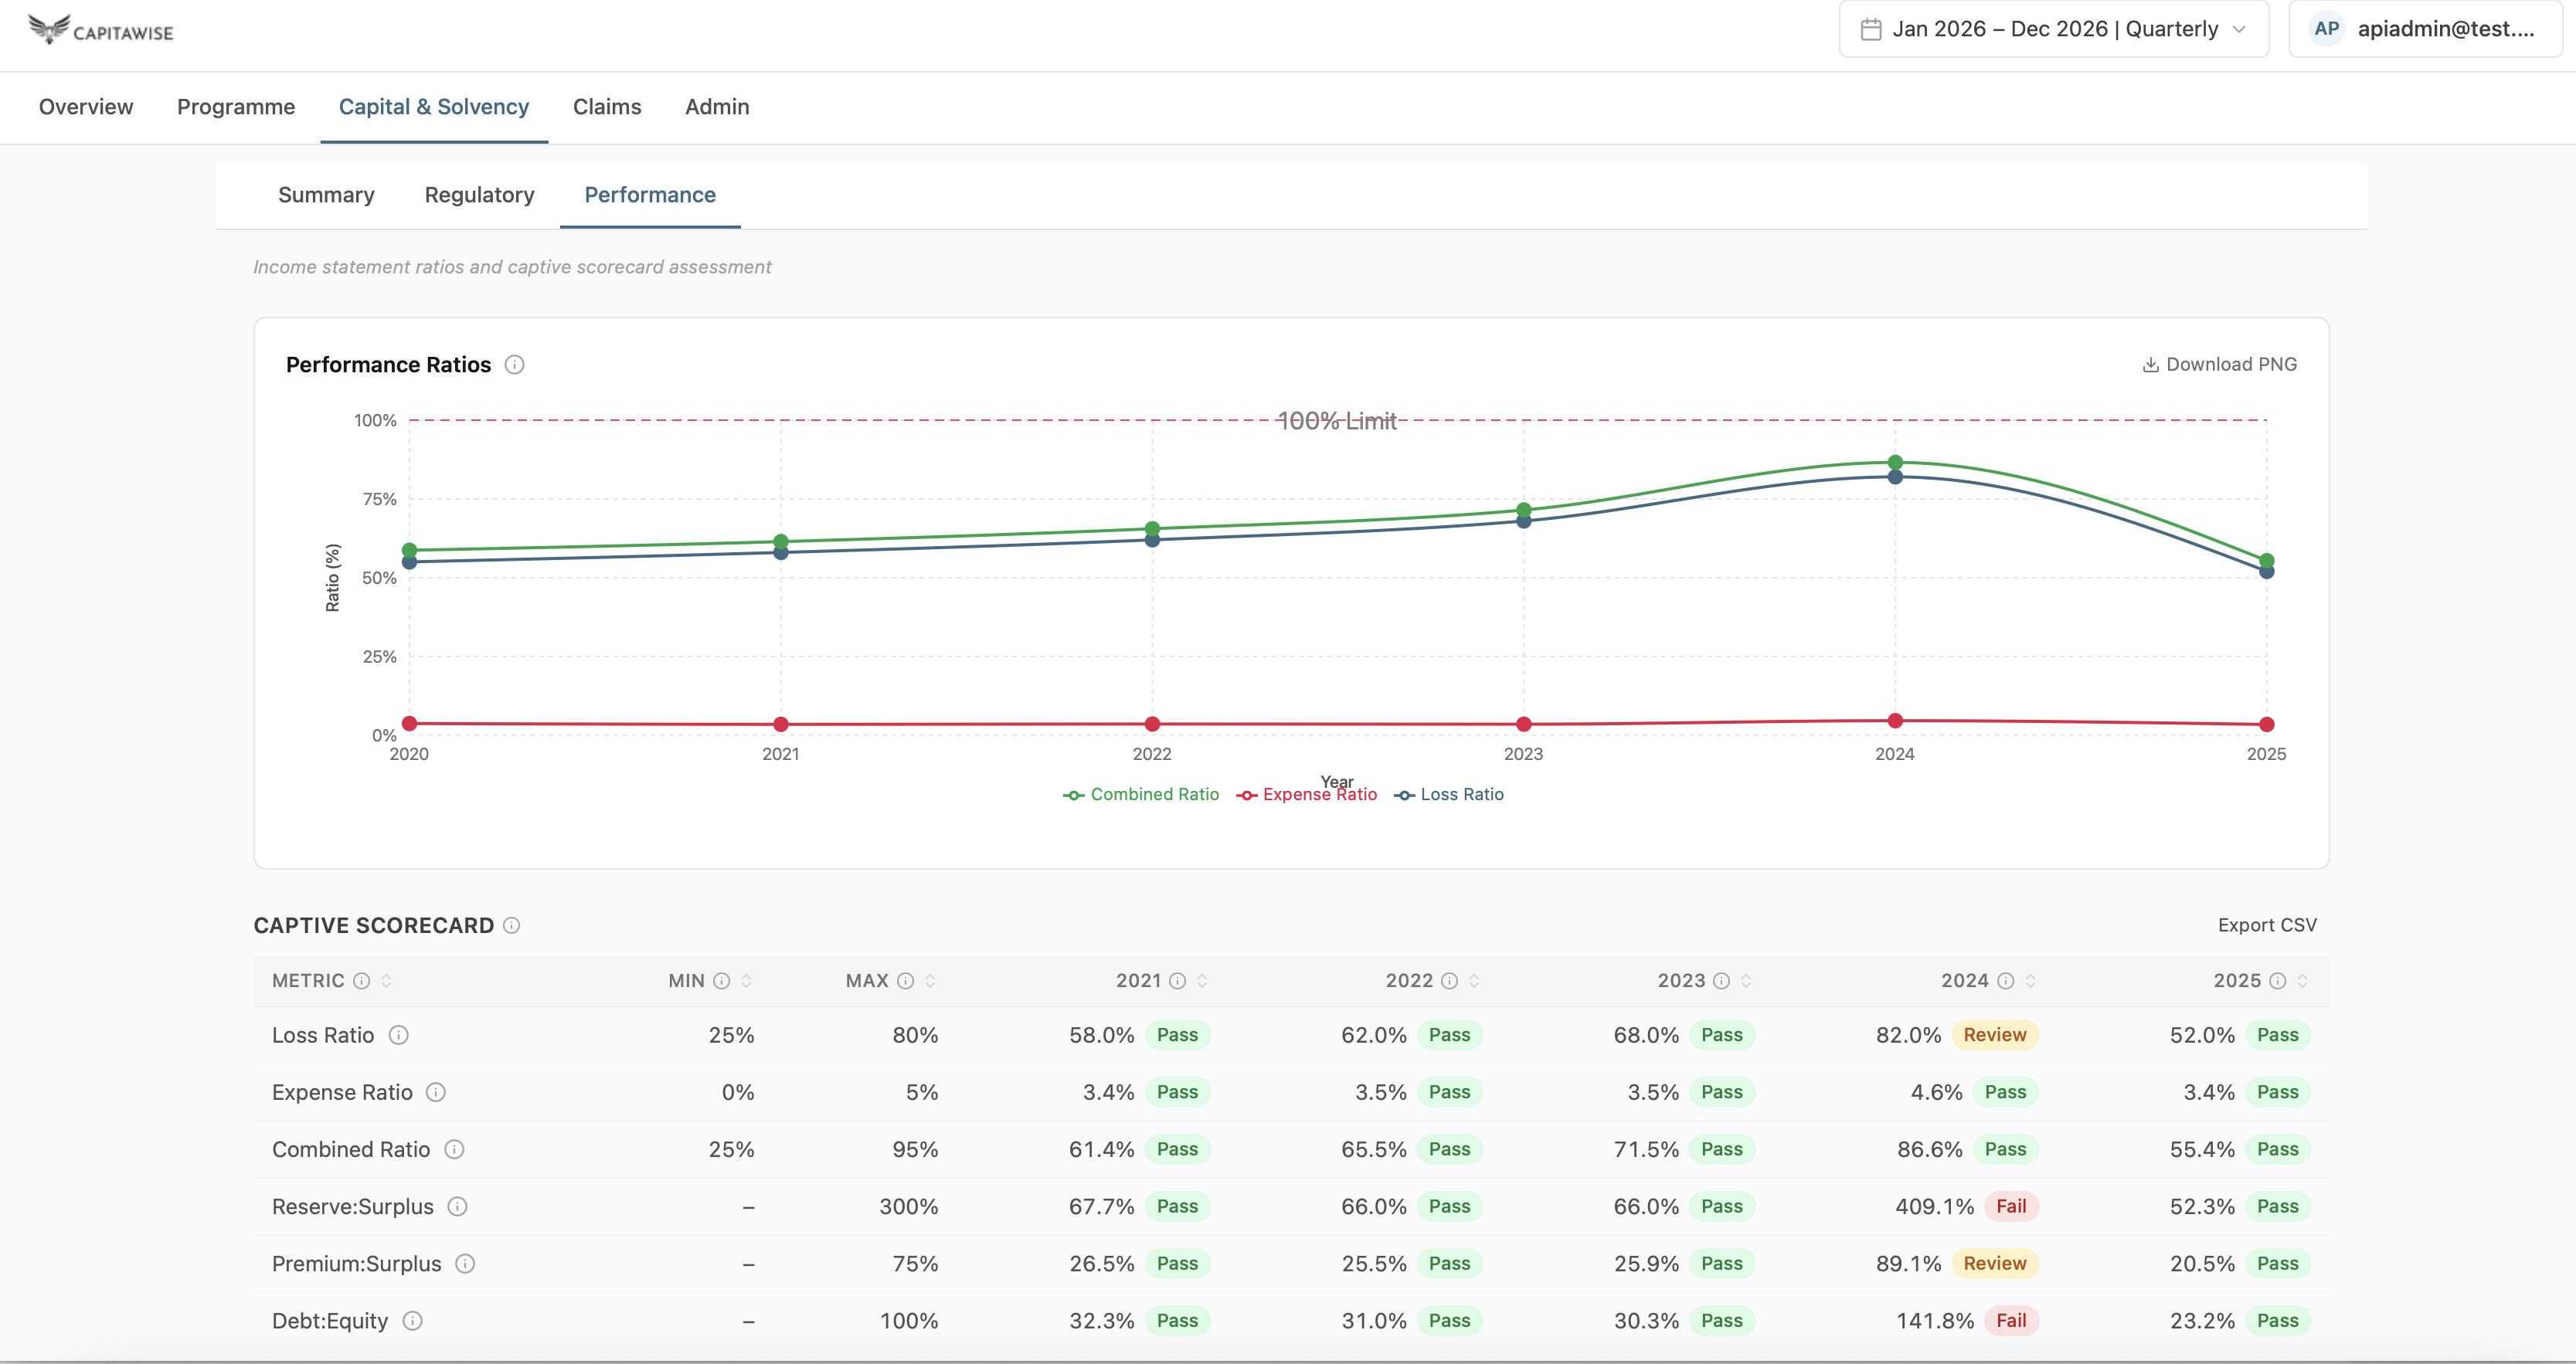
If a one-page view of your captive's health would be useful, we would welcome the chance to show it to you using your own data. Get in touch.
Tags
Sources
Frequently asked questions
What does the Captive Scorecard measure?
Underwriting profitability, leverage against capital and reserves, and liquidity, tracked year by year in a single grid.
How are the marks decided?
Each ratio is calculated with standard formulas from your captive's own figures, then compared against the thresholds you set, using fixed, transparent rules.
Can I set my own thresholds?
Yes. You set every level, and you can choose to set them tighter than your regulator's to build in extra headroom.
Who is it for?
Captive owners, managers and boards who want a clear, consistent view of captive health, ready for board meetings, audits and regulator conversations.
Last updated: September 15, 2026